
In this report we look at some of the major issues facing UK SMEs regarding international trade and payments
Trade with non-EU countries is growing for UK SMEs adding complexity and risk for currency payments
We estimate that UK companies wasted over £2.3bn on non-EU international goods payments in 2014
Contents
- Summary
- UK International Trade Overview
- Exports & Imports
- Obstacles to trade
- International invoicing
- International trade by region
- Conclusion
Summary
- British SMEs are less likely than European and American ones in general to trade internationally, but propensity increases with size of company.
- Smaller businesses have weathered eurozone economic weakness better than medium-sized ones. Greatest export prospects lie with emerging markets, outside the eurozone, however, creating more varied currency needs.
- Lack of tools for SMEs to manage foreign currency volatility is a major concern for British SME trading abroad.
- Lack of awareness of non-bank foreign exchange services and products unnecessarily adds billions of pounds to the cost of exporting and importing, with SMEs suffering disproportionately.
- We estimate UK companies exporting outside the EU needlessly spent upwards of £670m on direct currency-related costs in 2014.
- UK importers sourcing from non-EU countries wasted upwards of £1.6bn on direct currency-related costs in 2014.
UK International Trade Overview
British SMEs are more likely to export than import, while the reverse is true for larger companies.
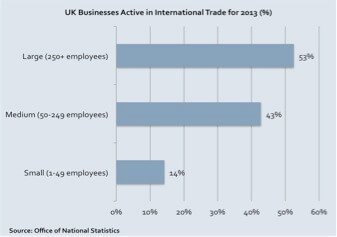
European small and medium enterprises (SMEs) are among the most internationalised in the world. A 2009 survey conducted by the European Commission found that of 9,480 SMEs surveyed in 33 European countries, 25% had traded internationally in the previous three years. UK SMEs are a little less likely than their mainland European counterparts to trade abroad. According to the latest Annual Business Survey by the UK’s Office for National Statistics (ONS) released in November, 15.6% of all UK businesses traded internationally in 2013, including imports and/or exports, up from 15.2% in 2012. UK firms are slightly more likely to export than to import, all sectors combined; 11.3% of businesses exported goods and services in 2013, while 10.7% were importers. Businesses’ involvement in international trade is largely a function of their size. In 2013, 15% of UK small businesses (1-49 employees) traded internationally, up from 14.5% in 2012. However, this pales in comparison to the 42.4% of medium (50-249 employees) and 52.7% of large (250+ employees) firms involved in international trade.
Small businesses were marginally more likely to export goods or services (10.8%) than to import (10.1%) in 2013 (the latest data available). However, the proportion changes as businesses increase in size, with larger companies more likely to import, due in part to their higher cash flow. Of medium-sized firms surveyed, 34% exported and 37% imported in 2013; 40.7% of large firms (250+ employees) exported and 48.6% imported in 2013.
Data from Western Union’s Q4 2014 International Trade Monitor (ITM), a survey of 1,000 UK SMEs involved in international trade, in January found that the average number of countries that British SMEs trade with is 2.3. This is a slight improvement from 2.1 six months earlier, but still much less than 4.5 for similarly sized US firms.
Exports & Imports
While propensity to trade internationally is generally growing, there are huge variances within sectors and between firms of different sizes.
While smaller firms in the UK are less engaged in international trade than larger ones, small businesses have shown more resilience in the face of the eurozone crisis in recent years. ONS data show that the percentage of UK small businesses that export goods or services increased from 10.2% of small firms in 2011 to 10.6% in 2012 and 10.8% (208,900 firms) in 2013. Medium-sized firms felt the impact of the difficult economic climate more keenly, however. The number of medium-sized companies exporting is still much higher than among small businesses, but it decreased from 35% of medium-sized firms in 2012 to 34% in 2013, putting them back on par with 2011 levels.
Companies in industry and agriculture are the most frequent exporters, compared to all other sectors. The percentage of these firms that export goods and services dropped by almost two percentage points in 2012, but improved to 22.7% in 2013. Companies in the distribution sector followed closely behind, with 17.9% exporting goods or services last year. Firms in non-financial services (10%) and construction (3.8%) were much less established in foreign markets.
The same trend applied to firms that import goods and services; among small businesses, the number of importers increased over the last three years from 9.3% in 2011 to 9.9% in 2012 and 10.1% in 2013. The percentage of medium-sized firms, however, dropped slightly from 37.6% to 37% over the same period. Companies in the distribution sector were the most active importers in 2013 (23.6%), followed by industry and agriculture (22.2%).
Obstacles to trade
Currency volatility is a major risk and business cost for SMEs which import and export.
In the April ITM survey, 56% of responding SMEs in the UK said that currency volatility was a concern for their business, five percentage points more than in the previous six months as sterling has appreciated against all major currencies since the start of the year. The October 2014 survey, however, found that only 35% of small businesses used products to mitigate their currency risk, relying instead on more volatile spot markets. Banks tend to offer products that allow companies to fix and hedge their exchange rate exposure only to larger companies with foreign currency needs of several million pounds. Smaller companies have generally been underserved when it comes to foreign currency issues, but an increasing number of non-bank specialist currency brokers can offer such products to companies with smaller fx requirements. As SMEs increase their international footprint, understanding how to send and receive international payments more efficiently – and how to access such products and services – will be key to limiting foreign exchange-related costs and de-risking the development of new export markets and suppliers.
Currency volatility is a major direct risk for importing and exporting companies, but there are also indirect risks stemming from it such as the impact of sterling strength on competitiveness and cash flow. The EU represents the UK’s largest export market, receiving 43.7% of all goods exports in 2014, so a stronger pound presents a serious threat to UK export revenue, as exports to Europe become more expensive, and exports elsewhere find it harder to compete against cheaper European suppliers. Given the subdued economic recovery in the Eurozone, late payments by European customers may also remain a lingering concern.
International invoicing
Despite products allowing companies to invoice in foreign currencies, sterling is the currency of choice for invoicing non-EU customers, followed by the dollar. The dollar is most popular when UK importers are invoiced from outside the EU.
While trade with the EU is overwhelmingly settled in euros, exports to non-EU countries are invoiced mostly in sterling (60.8% of the total value), according to HMRC data for 2013 (the latest period available). While the US received only 20% of the UK’s global non-EU exports, the dollar was used to invoice 33.9% of the £199.6bn total, followed by the euro (2.8%) and the Japanese yen (0.4%). For UK importers, the US dollar is the most popular currency in which to be invoiced from non-EU countries (65.6% of value). Sterling, with 22.7% of the total, was the second most popular currency in which UK companies were invoiced for imports, followed by the euro (5.2%) and Canadian dollar (2.8%).
There is considerable variation by industry sector, however. Exporters of chemical and related products - which comprise the second largest specific industry sector, with exports of £21.6bn 10.8% of the non-EU total - do the least invoicing in sterling. Sterling invoices account for only 45% of the industry's non-EU export, while 40.7% are invoiced in US dollars, and 4.9% in euros. At the other end of the scale, exporters of animal and vegetable oils, fats and waxes invoice the most in sterling with 85.8%, but this is by a large margin the smallest sector, exporting only £89m in 2013. Notwithstanding the nature of the product and its pricing, as well as export destination, smaller operators within smaller industrial sectors do not necessarily have the scale and capacity to justify financial services such as non-sterling invoicing and non-sterling accounts or fixing rates that can ease the process and costs of transacting internationally.
Invoice currency for non-EU trade (% of value)
| Pound sterling | US dollar | Euro | Canadian dollar | Japanese yen | Other | Total | |
|---|---|---|---|---|---|---|---|
| UK imports | 22.7% | 65.6% | 5.2% | 2.8% | - | 3.6% | 100% |
| UK exports | 60.8% | 33.9% | 2.8% | - | 0.4% | 2.2% | 100% |
Conversely, the animal and vegetable oils, fats and waxes sector does the most importing in foreign currency and the least in sterling - 92.4% and 5% respectively, compared to 65.6% and 22.7% for non-EU exports as a whole. Total imports in the category are over four and half times as large as exports, but the mismatch between costs in one currency and revenue in another can have a large impact on the finances of smaller operators.
Across all sectors, some two thirds of non-EU imports are paid in dollars, even though only 16% (edging up to 16.7% in 2014) of non-EU imports actually originated in the US, despite the US being the main non-EU source. The total is skewed by the fact that global commodities are overwhelmingly priced in dollars - mineral fuels, for example, are consistently the largest product import, accounting for around a fifth of the total - and that imports from China, the next largest, as well as India, are invoiced in dollars or sterling given the difficulty of getting renminbi and rupees offshore.
Not all foreign currency receipts will necessarily need to be converted into sterling, given that many companies will have some costs in euros or dollars. US bank JP Morgan estimates that anywhere between 25% and 40% of total US corporate cash stockpiles are held offshore. No comparative estimates exist for UK companies, but the proportion is likely to be considerably less given that the tax implications of repatriating cash are not as burdensome as in the US. Adjusting for trade and tax differences, we estimate the proportion of non-sterling receipts kept offshore by UK companies – for reasons such as funding local currency costs of country-specific regulations and use of non-bank providers for business forex – to be 20%-30% of the total. This leaves 70%-80% of non-sterling receipts to be repatriated using banks. The margins banks put on their foreign exchange transfers usually narrow the higher the amounts and volumes sent, but can range from less than 0.5% to over 4%. We assume transfers using traditional bank services at an average margin of 2.1% (attributable to bank’s exchange rates, plus fees and commissions, especially for smaller transactions and companies compared to specialist currency brokers). Accordingly, we estimate that some £820-940m was wasted in the currency transaction process in 2013 by using banks (at their standard rates), rather than negotiating a better deal with a bank or using a non-bank provider. Exports to outside the EU fell by 18% in 2014, but UK exporters could still have wasted some £670-770m on bringing back proceeds.
Invoicing in sterling may help the exporter avoid direct transfer costs, but simply shifts these costs on to the customer. For non-EU buyers of UK goods paying in sterling, these additional costs could potentially have reached the equivalent of some £1.3-1.5bn in 2014, and £1-1.2bn in 2014.
An even greater percentage of UK goods imports are payable in non-sterling currencies, so currency-related import costs (independent of other financing and insurance costs etc.), were considerably higher if standard bank channels were used. Using the same assumptions as above, we estimate that UK importers sourcing from non-EU countries needlessly spent upwards of £1.6-1.9bn on currency-related costs alone in 2013, and £1.6-1.8bn in 2014.
As with exporting, paying in sterling may not necessarily have saved UK importers much either. By invoicing UK buyers in sterling, non-EU suppliers could have incurred additional cost in the region of the equivalent of £480-550m in 2013, and £470-540m in 2014. Most of these costs could well have been passed on to buyers.
Table: Currency cost estimates in non-EU trade, 2013-2014
| 2013 | 2014 | |
|---|---|---|
| Costs to UK companies buying/selling in foreign currencies | ||
| Imports | £1.6-1.9bn | £1.6-1.8bn |
| Exports | £820-940m | £670-770m |
| Total | £2.5-2.8bn | £2.3-2.6bn |
| Costs to overseas customers and suppliers buying/selling in sterling | ||
| Imports | £480-550m | £470-540m |
| Exports | £1.3-1.5bn | £1-1.2bn |
| Total | £1.8-2bn | £1.5-1.7bn |
International trade by region
Access to non-traditional currencies and payment services will support the development of new markets.
The lion’s share of UK trade is with countries in the EU with 50% of all goods imports and exports, amounting to £365.3bn in 2014. Germany is the UK’s single largest trade partner and accounted for exchanges worth £90.8bn, or 12.5% of total trade. The US is the next largest trade partner at £71.7bn (9.8%), followed by the Netherlands, China, France, Belgium, and Switzerland.
In terms of the UK’s total trade volume, exchanges with non-EU countries fell by 10% in 2014 to £360.5bn, driven by an 18% contraction in non-EU exports, although this figure is distorted by particularly high exports in 2013. The eurozone may still be the largest trading partner, but non-EU trade has grown much faster in recent years. Given the muted recovery in the eurozone, this trend will continue.
China has risen to become the UK’s fourth largest trade partner overall in 2014, from sixth in 2013, and the second outside the EU; bilateral exchanges amounted to £49.8bn, ahead of France with £44.5bn. As is often the case, trade flows are dominated by Chinese imports. The UK imported goods worth £33.9bn, making it the UK’s second largest supplier, overtaking the US. However, China is also the UK’s seventh largest export market, and trade is growing rapidly. While UK exports to each of its top six markets, with the exception of Germany, decreased in 2014 compared to the previous year, exports to China expanded by a whopping 37.5% year-on-year to reach £15.9bn.
While Europe is the UK’s largest export market, receiving 47.3% of all British goods, the stronger pound is having a profound effect. This challenge to the UK’s export competitiveness, together with the subdued European economic context, is encouraging British companies to accelerate efforts to tap new markets: the EU’s share of British exports has been falling for years, from a peak of 61.9% in 2006 to 47.3% in 2014. The Q1 Business Trends Survey from EEF, the UK’s manufacturers’ organisation found that while manufacturers reported the first, albeit marginal, rise in export demand since Q2 2014, over 40% of manufacturers reported no net improvement. The picture is harder for smaller companies that are more exposed to Europe and less likely to have access to newer markets, contributing to a squeeze on export margins. While European markets remain the most accessible for SMEs, the government is focusing efforts to support SME explore opportunities in faster growing and more dynamic markets such as China.
Conclusion
There are many challenges involved in trading abroad, whether exporting or importing. But while currency and foreign payments issues are a major concern, especially for small and medium sized businesses, they are all too often seen as an ‘inevitable’ cost of dealing with foreign currencies. As such, efforts to mitigate these concerns are often limited, whether through lack of knowledge about, or access to, financial products and services that have the potential to reduce the challenges and costs associated with paying or invoicing in foreign currencies. Particularly for SMEs, non-bank providers have the opportunity to meet this demand.
Sources:
- UK Trade Info
- EEF, “Manufacturing Outlook 2015 Q1”
- ONS, “Exporters and Importers in Great Britain, 2013”
- EU, “Internationalisation of European SMEs”
- EU, SME Internationalisation Portal
- Western Union “International Trade Monitor”